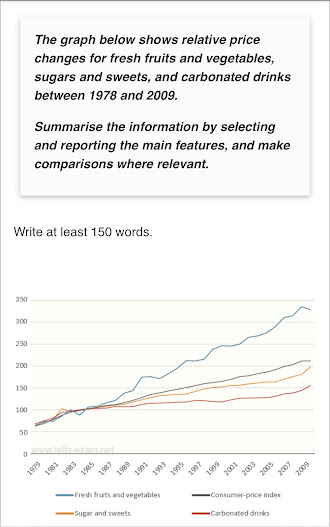
A multiple fluctuating line graph illustrates the comparative price variations for Fresh Fruits and Vegetables (FFV), Sugar and Sweets (SS), and Carbonated Drinks (CD) from 1978 to 2009. Moreover, this chart has also provided information about a change in Consumer-Price Index (CPI). Overall, every given type recorded a price hike, and CPI also registered continuous inclination during three decades.
In 1979, all parameters were on nearly 60% changes including CPI, and approximately the same proportions were documented till 1981 in all categories. Again, the prices were fairly the same for all; however, SS reached just over 100%. In 1984, FFV tanked to 80%, but others kept on following an upward trend. In 1991, FFV noted 175% change which was close to 35%, 50%, and 55% more than CPI, SS, and CD, respectively.
After a decade, the highest change was enlisted in FFV at 250%. CPI was at 175%, SS reached 160%, and CD was at 125%. After facing the same trend in the coming years, the total change in FFV was 325% in 2009. In the same year, CPI boosted to 210% change, SS expanded to around 200%, and CD went just over 150%.
