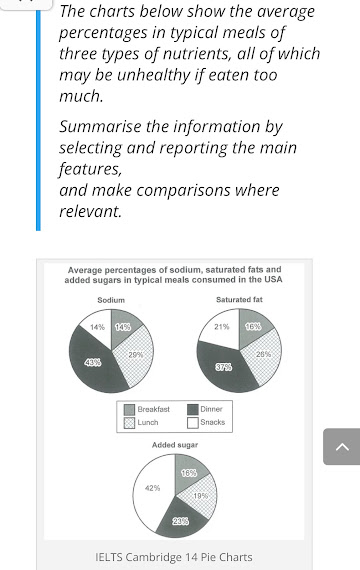
Three pie charts emphasise the mean proportion of particular meals of three different types of nutrients which are unhealthy for consumers if taken in excess.
The data belongs to the USA.
Overall, the highest ratio of these materials had been consumed at dinner; however, the lowest belonged to breakfast.
According to the given data, 43% of Sodium was used at dinner. It was then followed by lunchtime by touching one per cent below three in ten. During breakfast and snacks, an identical proportion was registered. It was fourteen per cent each.
Heading towards Saturated fat, the peak amount was eaten at dinner again. It was 37%. This proportion was sixteen per cent, 21%, and eleven per cent more than snacks, breakfast, and lunch, respectively.
Finally, added sugar had also used by people. Its maximum proportion was consumed in the evening time. It was 42%. At dinner, almost the half proportion was consumed compared to snacks. Lunch and Breakfast times were recorded at 19% and 16%, separately.
